
Screen content video dataset and benchmark
Screen Content Dataset
Screen sharing is a common feature in video conferencing applications, especially for remote work and presentations. However, internet conditions such as limited bandwidth, packet loss, and compression can significantly reduce the visual quality of shared screen content. Most existing video quality metrics are designed for natural scenes and were not benchmarked on screen content. In this work, we present a large-scale subjective dataset of screen content videos captured from video conferencing apps. The dataset includes 1,600 distorted videos with corresponding subjective quality scores. Subjective scores were collected using crowdsourced pairwise comparisons. The dataset provides a valuable resource for developing and benchmarking video quality metrics tailored to screen content. The evaluation of objective metrics revealed that several generalpurpose quality metrics outperform both full-reference and no-reference metrics.
Cite us
@inproceedings{scvqa2025,
  author    = {Nikolai Safonov and Mikhail Rakhmanov and Dmitriy Vatolin},
  title     = {Screen Content Video Dataset and Benchmark},
  booktitle = {Proceedings of the 33rd ACM International Conference on Multimedia (MM '25)},
  year      = {2025},
  publisher = {Association for Computing Machinery},а
  doi       = {10.1145/3746027.3758306},
  isbn      = {979-8-4007-2035-2/2025/10}
}
Benchmark
Leaderboard
The chart below shows the correlation of metrics with subjective scores on our dataset. You can choose the type of correlation. We recommend that you focus on Spearman’s rank correlation coefficient. We also highlighting metrics developed specially for the screen content.
Speed-Quality
Chart below shows Speed-Quality characteristics of metrics.
Correlation of metrics on Natural Scenes and Screen Content
Comparison of metrics shift on natural videos on the images below. We compare metrics performance on proposed screen content dataset and CVQAD dataset containing natural professional and UGC videos compressed with different types of encoders.
Data description
The archive contains a set of numbered folders, each corresponding to a specific video.
Inside each folder, you will find several distorted versions of the video along with the original file, named orig.mkv.
The file Subjective_scores.csv provides subjective quality scores for each method on each video, along with a brief description of the applied distortions.
Due to the nature of video conferencing applications, which may drop frames under limited network conditions, some distorted video versions may not contain all frames from the original. To account for this, we include a mapping between frames in the distorted versions and the original video. To facilitate frame alignment between the original and distorted videos, a rectangular region displaying a timer was embedded into each frame. During preprocessing, this region was consistently cropped, and the embedded timestamps were extracted. These extracted time values were then used to accurately align frames by matching corresponding timestamps. Before the subjective tests area with the timer was cropped out.
The mapping is provided in the file frames_mappings.json, which links frame indices from the original videos to their corresponding frames in selected distorted versions. The file has following structure:
{[Original sequence] : [Method] : [Distorted frame index] : [Сorresponding original frame index]}
``
Methodology
Video preparation
To construct a diverse and representative set of reference videos, we recorded a wide range of screen content typically encountered in real-world scenarios. This includes slide-based presentations, code editors, terminal windows, web browsing, spreadsheets, data visualizations, mixed-content graphical interfaces and gaming. Care was taken to include both static and dynamic content, varying text sizes, color schemes, background complexities, and interaction patterns (e.g., mouse movements, scrolling, typing). All reference videos were captured at 1920x1080 resolution and 30 frames per second to ensure high visual fidelity. The recordings were captured using OBS Studio with lossless compression and 4:4:4 chroma subsampling. In total, the dataset includes 100 reference videos with durations ranging from 7 to 10 seconds.
We generated distorted video versions using two main approaches: screen recording of video conferencing apps and video compression with standard codecs. For the video conference apps recording, we used OBS Studio with lossless compression and 4:4:4 chroma subsampling. The color space settings were configured to match the original content, ensuring that recordings without transmission produce frames identical to the source video. This is critical for enabling accurate full-reference quality evaluation. Most recordings were made in native FullHD resolution. However, two services (Google Meet and Microsoft Teams) have no full-screen mode without interface elements. After cropping these interface elements, the resulting streams were rescaled to FullHD resolution. As a result, these videos are not pixel-aligned with the original reference and are therefore unsuitable for full-reference metric evaluation. They should be excluded when validating full-reference VQA models.
To emulate network fluctuations during screen content transmission, we used the tc-netem module on the sender side. Before each streaming session, specific network profiles were configured to simulate constrained network conditions. Both the transmitter and receiver machines were connected to a high-speed network with stable baseline conditions. The available bandwidth exceeded 100 Mbps, and baseline packet loss was consistently below 1%, ensuring that any observed degradation was due to the imposed emulation settings.
Alignment
Accurate frame alignment between original and distorted videos is crucial for the reliable application of full-reference video quality metrics. To match frames of the original and the distorted versions, we added a rectangular area with a timer. On the alignment stage from each frame, a fixed region containing the timer was cropped. Text within this region was recognized using pytesseract. The recognized timestamps were used to match frames based on their displayed time values. To improve alignment robustness and reduce OCR errors, we added a horizontal progress bar above the timer during recording. This provided an additional feature for alignment by matching the relative length of the bar across frames. If the OCR failed to produce a valid match, the system flagged the frame and requested manual verification. The timer areas were removed before the subjective evaluation by cropping frames horizontally. This alignment procedure allows us to map distorted frames to their original counterparts, enabling usage of full-reference VQA models in our benchmark.
Subjective Test
We used subjective pairwise comparison to rank the distorted video versions. Subjective votes were collected using crowdsourcing, for the evaluation, we used side-by-side preference selection. Participants were asked to choose which of two videos had better visual quality, with three response options: “left,” “right,” or “can’t choose.” Each participant evaluated 20 video pairs, including 2 hidden validation pairs with known answers. These validation pairs were created by compressing original videos using high CRF values to
IQA methods calculation
Due to the results of our small (in terms of the data size) research for IQA methods Mean Temporal Pooling was selected as a way of aggregatig of each frame scores.
Therefore, to get a quality score for a video using IQA methods, we compared the given distorted sequence frame by frame with the corresponding frames of the reference video and then averaged calculated scores. The research mentioned above will be reproduced with more data in the future.
- To encode the video we used the following command:
ffmpeg −f rawvideo −vcodec rawvideo −s {width}x{height} −r {FPS} −pix_fmt yuv420p −i {video name}.yuv −c:v libx265 −x265−params " lossless =1:qp=0" −t {hours : minutes : seconds} −vsync 0 {video name}.mp4
- To decode the video back to YUV you can use:
ffmpeg -i {video name}.mp4 -pix_fmt yuv420p -vcodec rawvideo -f rawvideo {video name}.yuv
- To convert the encoded video to the set of PNG images you can use:
ffmpeg -i {video name}.mp4 {frames dir}/frame_%05d.png
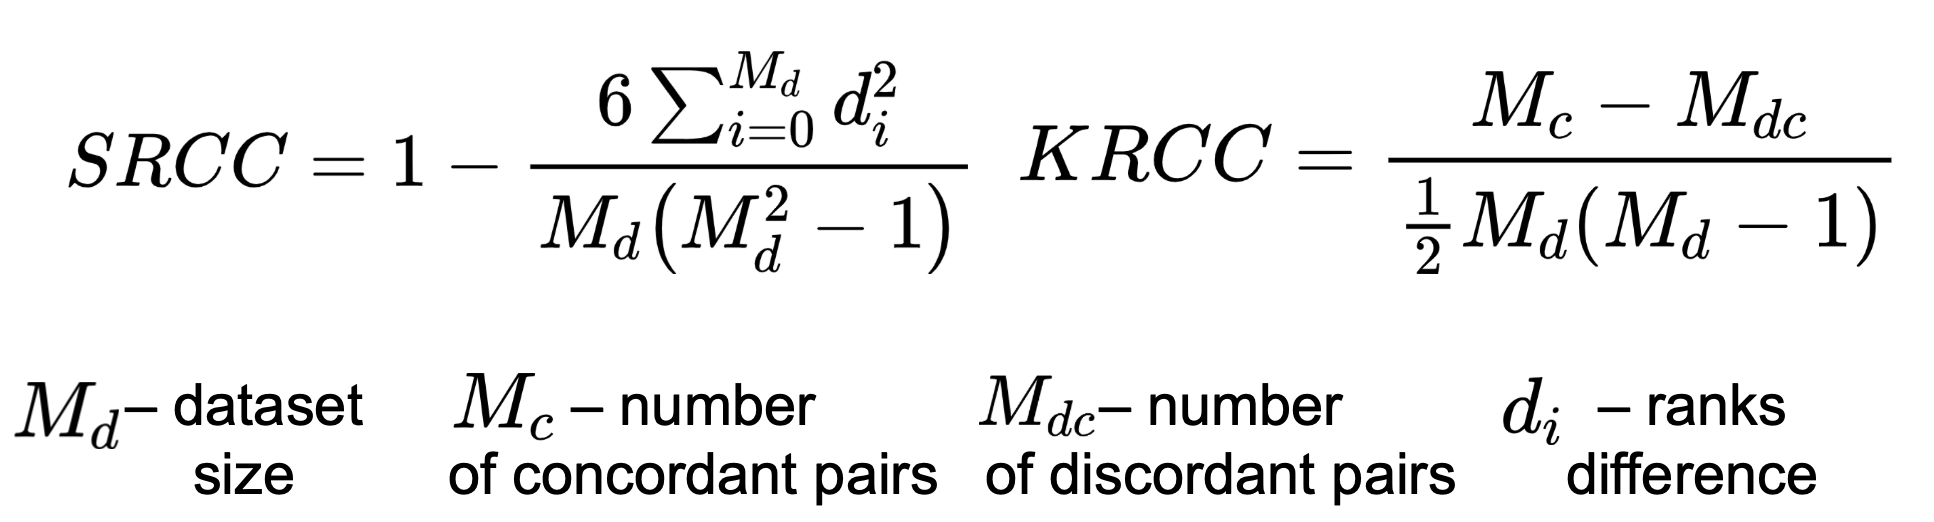
Correlation coefficients
To calculate correlation measure subjective scores and metric’s output we chose Spearman’s Rank Correlation Coefficient (SRCC), Kendall’s Rank Correlation Coefficient (KRCC). Both measure the prediction monotonicity (the limit, to which the quality scores of a metric agree with the relative magnitude of the subjective scores).
Speed perfomance
We have also measured the metrics speed performance, expressed in FPS (the execution time of a full model runtime divided by the number of sequence frames).
- Used videos:
- 5 reference videos
- 3 metric calculation for each distorted video
- 15 compressed videos and 45 total amount of measurements
- Output: maximum FPS of metric on any video.
- Calculations were made using the following hardware:
- NVIDIA Titan RTX GPU
- 64 CPUs cluster, Intel(R) Xeon(R) Silver 4216 CPU @ 2.10GHz
Metrics
| Name | IQA/VQA | Type | Implementation |
|---|---|---|---|
| ARNIQA [3] | IQA | NR | Link |
| BRISQUE [5] | IQA | NR | Link |
| CLIP IQA [7] | IQA | NR | Link |
| CLIP-IQA+ [8] | IQA | NR | Link |
| CONTRIQUE [12] | IQA | NR | Link |
| COVER [13] | VQA | NR | Link |
| CVRKD [14] | IQA | FR | Link |
| DBCNN [15] | IQA | NR | Link |
| DISTS [16] | IQA | FR | Link |
| DOVER [17] | VQA | NR | Link |
| EONSS [21] | IQA | NR | Link |
| FSIM [25] | IQA | FR | Link |
| FasterVQA [26] | VQA | NR | Link |
| HyperIQA [32] | IQA | NR | Link |
| IW-SSIM [33] | IQA | FR | Link |
| KonCept512 [34] | IQA | NR | Link |
| Koncept [35] | IQA | NR | Link |
| LINEARITY [36] | IQA | NR | Link |
| LIQE [37] | IQA | NR | Link |
| LPIPS [38] | IQA | FR | Link |
| MANIQA [43] | IQA | NR | Link |
| MDTVSFA [45] | VQA | NR | Link |
| MEON [46] | IQA | NR | – |
| MUSIQ [52] | IQA | NR | Link |
| PAQ-2-PIQ [56] | IQA | NR | Link |
| PIQE [57] | IQA | NR | Link |
| PSNR | IQA | FR | MSU VQMT |
| RankIQA [60] | IQA | NR | Link |
| SPAQ [61] | IQA | NR | Link |
| SSIM [63] | IQA | FR | MSU VQMT |
| TOPIQ [70] | IQA | FR | Link |
| TRES [71] | IQA | NR | Link |
| VMAF [75] | VQA | FR | MSU VQMT |
| VQM | VQA | FR | MSU VQMT |
Contact us
For questions, propositions please contact authors: nikolay.safonov@graphics.cs.msu.ru, mihail.rakhmanov@graphics.cs.msu.ru, dmitriy@graphics.cs.msu.ru